matplotlibの三次元プロットの見栄えを良くする その2
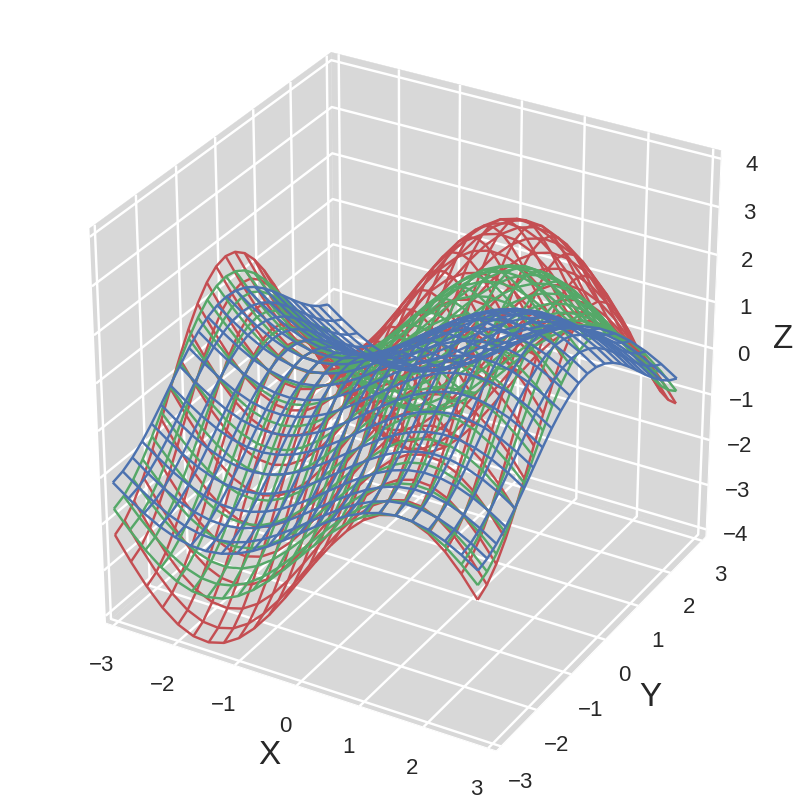
上の例でsurfaceでなくwireframeにしたければ, STARTからENDまでを
x = np.arange(-3, 3, 0.25)
y = np.arange(-3, 3, 0.25)
X, Y = np.meshgrid(x, y)
Z = np.sin(X)+ np.cos(Y)

for i in range(3):
    ax.plot_wireframe(X, Y, Z * (i * 0.5 + 1), color=color_palette[i % len(color_palette)])
などとすれば良い.
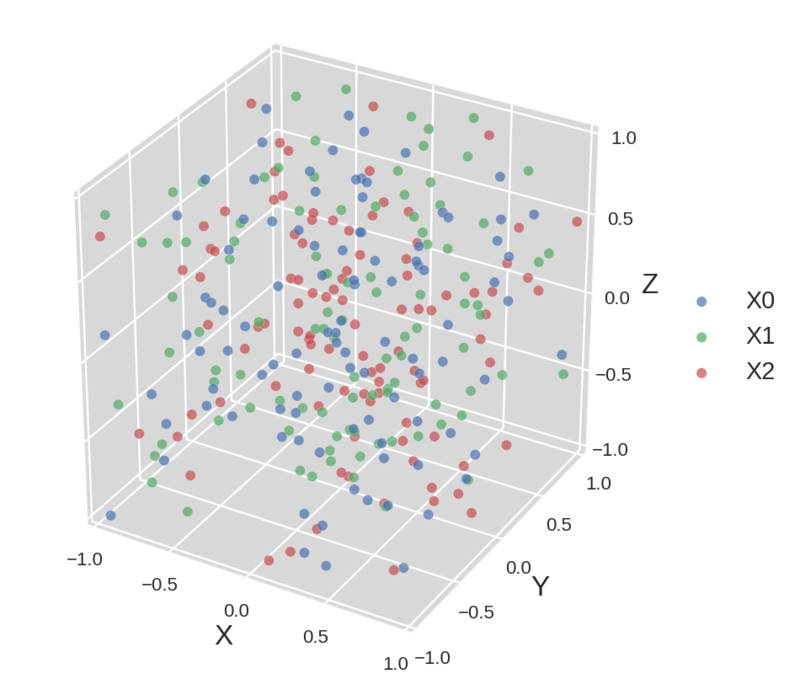
scatterプロットの場合, やはりlegendを表示させたいがこれは状況に応じて少し調整が必要である.
fig = plt.figure(figsize=(9.5, 8), dpi=80)

# ...
#XXX: START

for i in range(3):
    ax.scatter3D(
        np.random.uniform(-1, 1, 100), np.random.uniform(-1, 1, 100), np.random.uniform(-1, 1, 100),
        label='X{}'.format(i),
        c=color_palette[i % len(color_palette)], s=80, edgecolors='white', alpha=0.7)  #XXX: 'color' doesn't work. Use 'c'.
ax.set_xlim(-1, 1)
ax.set_ylim(-1, 1)
ax.set_zlim(-1, 1)

#XXX: END

ax.legend(loc='center left', bbox_to_anchor=(1.05, 0.5), fontsize='xx-large')

plt.subplots_adjust(left=0, right=0.83, top=1, bottom=0)
レジェンドの文字長(横幅)に応じて, figureのfigsizeの横幅(9.5), legendのbbox_to_anchorの横幅(1.2), subplot_adjustのright(0.83)を適宜調節して下さい.
scatterのlegendはmatplotlib 1.4などではまだうまく動かないのでダミーでlabelを用意するなどの回避策が必要になるようです.

